CUDA Profiler for Production Inference By Dmitri Melikyan |
Why dev-time CUDA profilers don't fit production inference, and what a profiler built for it looks like: low-overhead kernel attribution, host sync waits, and integrated telemetry.
Most CUDA profilers were built for a developer staring at a single run on a workstation. Production inference is a different problem: thousands of requests in flight, GPUs running flat out, and behavior that only shows up under real load. This post looks at what makes profiling production inference hard, and what a profiler designed for it does differently.
What Makes Production Inference Profiling Different
Full kernel traces don’t scale. A serving engine launches kernels at enormous rates. Recording every single kernel call - the default mental model for a dev profiler - produces traces too large to store, move, or reason about, and adds overhead you can’t afford in production. At the same time, second-level metrics hide everything that matters. The useful target is in between: a timeline resolution high enough to expose where GPU activity actually goes, without tracing every call individually.
Findings have to be actionable at the inference-engine level. A flat list of kernel names doesn’t tell an inference engineer much. What’s actionable is time grouped by what the engine is doing: attention, matrix multiply, communication/collectives, KV cache, quantization, normalization, sampling, memory movement. That’s the vocabulary you tune against.
It has to work at production scale. Inference rarely runs on one GPU. Bottlenecks live across replicas and across the cluster, so profiling can’t be a one-host, one-session activity - it has to be always-on across every instance.
Overhead is a hard constraint. Dev profilers routinely add large slowdowns; that’s acceptable on a laptop and unacceptable on a serving fleet. A production profiler has to stay in the low-overhead regime continuously.
Root permissions are a blocker. Many GPU profiling features require root or CAP_SYS_ADMIN to access hardware performance counters. In production - especially in containers and managed Kubernetes - that privilege often isn’t available, and asking for it is a non-starter. A production profiler has to deliver value without elevated privileges.
Attributing Latency to Kernels
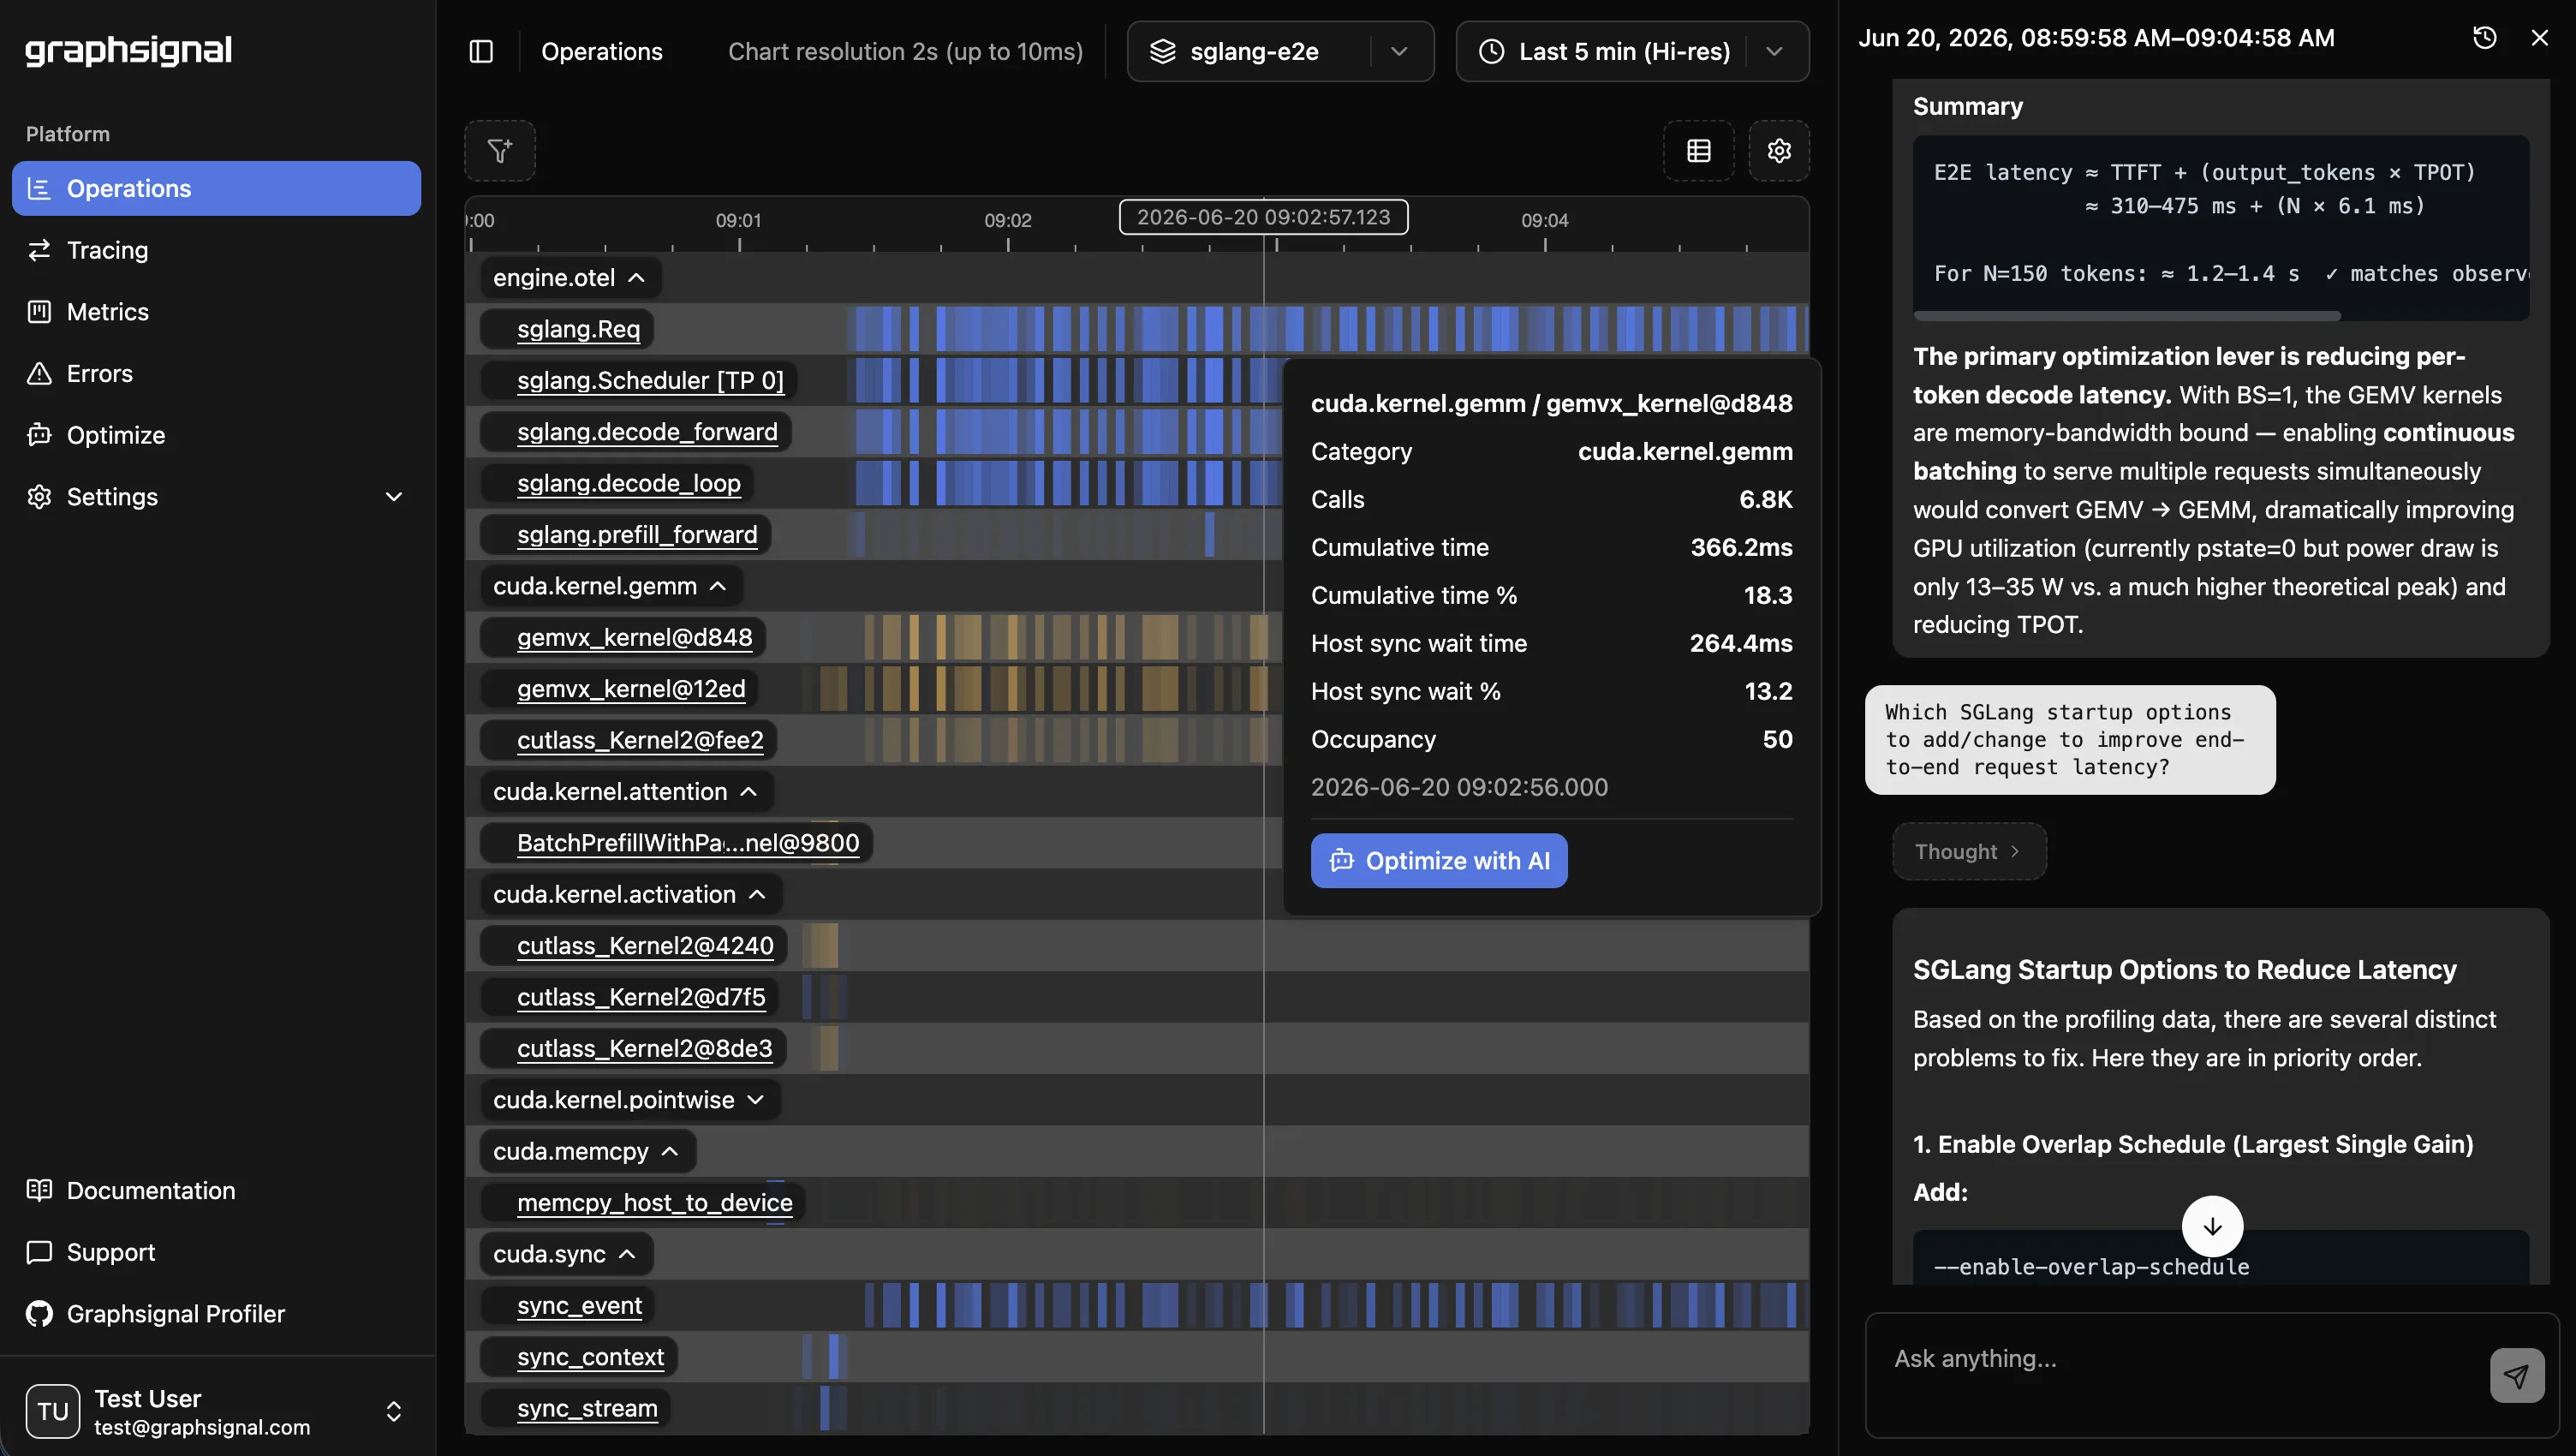
Graphsignal builds kernel timelines from CUDA activity records and attributes them to inference-engine concepts. Instead of a raw kernel dump, you get GPU time grouped by activity type, with the top kernels broken out and the long tail aggregated - so “attention is 40% of GPU time” is a question you can answer directly.
Just as important as where the GPU spends time is where the host waits on the GPU. Blocking synchronization calls (cudaDeviceSynchronize, cudaStreamSynchronize, cudaEventSynchronize) tell you when the CPU side is stalled waiting for results. That distinction is what separates a GPU-bound bottleneck from a host-side scheduling bottleneck - and it’s the difference between optimizing kernels and optimizing the engine loop. A profiler that only shows kernel timelines, with no host sync attribution, can’t make that call for you.
Integrated Telemetry: OpenTelemetry, Prometheus, and GPU Metrics
A kernel profile in isolation only tells part of the story. Graphsignal folds telemetry from the rest of the stack into the same picture for the same time window:
- Engine request traces via OpenTelemetry from supported engines (vLLM, SGLang), so generate spans and per-request latency sit alongside the profile.
- Engine metrics scraped from the workload’s Prometheus endpoint - throughput, queue depth, cache hit rates, and the rest of the engine’s own counters.
- GPU metrics via NVML: utilization, memory, temperature, power, clocks, PCIe and NVLink throughput, and error events (ECC, XID).
The result is one surface where you can move from “tail latency rose” to “attention kernels grew” to “NVLink saturated” without stitching tools together by hand.
Built for AI Coding Agents
Inference-time telemetry is dense, and reading it by hand is slow. Graphsignal is designed to be consumed by an AI coding agent. With the graphsignal-context skill installed, Claude Code (or Codex or Gemini) can fetch profiles, traces, metrics, and errors for an exact time window and reason about them in one pass.
Because nothing in the captured data includes prompts, completions, or other content, this stays safe to use on production traffic - the telemetry carries performance signal, not user data. See AI Optimization for setup.
Graphsignal vs. Nsight Systems
Nsight Systems is an excellent dev-time tool: capture a run, open the timeline, study every kernel and API call in detail. That model breaks in production. A full trace timeline assumes you can reason about one workload from start to finish - but a serving engine handling thousands of concurrent requests doesn’t have a “start to finish,” and a timeline of every kernel across that traffic is neither collectible at low overhead nor readable.
There’s also the permissions wall. Nsight’s GPU performance-counter and metric sampling features require root or CAP_SYS_ADMIN, which is frequently unavailable in production and containerized environments. Graphsignal takes the production-time approach instead: continuous, aggregated, low-overhead profiling from a sidecar process that needs no root or elevated privileges, with activity grouped to the engine level rather than dumped per call.
Graphsignal vs. eBPF Profilers
eBPF-based profilers are another common approach, but they fit production inference poorly for three reasons:
- Privileges. Loading eBPF programs requires elevated capabilities (
CAP_BPF/CAP_PERFMON, often effectively root). The same blocker as above, in a different place. - No host sync attribution. eBPF can sample CPU stacks, but it doesn’t give you CUDA host-side synchronization waits attributed against GPU activity - so it can’t tell you whether you’re GPU-bound or stalled waiting on the device.
- No engine telemetry. eBPF profiles aren’t joined to OpenTelemetry traces, Prometheus engine metrics, or GPU metrics. You get CPU flame graphs, not an inference-engine-level view correlated with request latency and hardware state.
Setup
Getting this running takes two steps. Install the profiler for your CUDA version:
UV_TOOL_BIN_DIR=/usr/local/bin uv tool install 'graphsignal[cu12]' # CUDA 12.x# orUV_TOOL_BIN_DIR=/usr/local/bin uv tool install 'graphsignal[cu13]' # CUDA 13.xOr to install into your workload’s environment:
pip install 'graphsignal[cu12]' # CUDA 12.x# orpip install 'graphsignal[cu13]' # CUDA 13.xThen wrap your launch command with graphsignal-run - no code changes, no root:
export GRAPHSIGNAL_API_KEY=<my-api-key>graphsignal-run vllm serve <model> --port 8000The profiler attaches as a sidecar and starts collecting CUDA kernel activity and GPU metrics as soon as CUDA initializes. Add --enable-otel to capture engine request traces, and it scrapes the engine’s Prometheus metrics automatically.
See the CUDA integration guide and Quick Start to start profiling, and follow @GraphsignalAI for updates.