Production GPU profiler for workload-aware, agent-driven inference optimization.
 AMD
AMD PyTorch
 vLLM
vLLM SGLang
 TensorRT
Optimize from production, not just the benchmark
Production workloads report what they actually did. An agent reads that back from wherever it works, finds what to fix, changes flags or code, and ships the result. See the production loop for how to set it up.
Production p95 TTFT rose from 0.9 s to 3.1 s after yesterday's deploy, while the local benchmark is unchanged. Reading what production actually did through the Signals API before touching anything.
  ⎻ 4 instances in the last 24 h, all vllm serve Qwen3-32B
  ⎻ gpu-node-3 e3fb15db0053  deploy.tag=v2026.10.09  first seen 19 h ago
  ⎻ engine, last 6 h: running 118 avg, waiting 23 avg, KV cache 97% used, prefix hits 31%
      TTFT p50 0.6 s  p95 3.1 s    e2e p95 24 s
  ⎻ errors: 2,140 warnings "preempted by PreemptionMode.RECOMPUTE"
  ⎻ kernels over the window:
      attn_prefill_kernel        41.3%
      gemm_bf16mma<128,128,64>   33.0%
      attn_decode_kernel         12.4%
The traffic is chat, so decode should dominate. Prefill at 41% is recomputation: the KV cache fills, sequences get preempted, and their prompts are prefilled again. 6 preemptions a minute. The benchmark never sees this because it runs 64 concurrent requests, not 118. Replaying the production request log locally under graphsignal-run with less concurrency and more KV memory.
  ⎻ replay 41 min, 0 preemptions, KV cache peak 89%
  ⎻ TTFT p95 1.2 s vs 2.9 s with the production flags on the same replay
  ⎻ generation +4.1% tok/s; attn_prefill_kernel share 41.3% → 19.6%
Recomputation gone, prefill share back where a chat mix belongs. Rolling the two flags to the canary on gpu-node-4. Reading its instance back through the API after an hour of real traffic before the rest of the fleet…
Observe your inference stack, not just your hosts
General-purpose monitoring sees a busy GPU. Graphsignal sees the engine and the kernels behind it: GPU telemetry, engine throughput and latency, time per kernel and CUDA graph, and errors as they happen, per model, engine, and GPU, across your fleet.
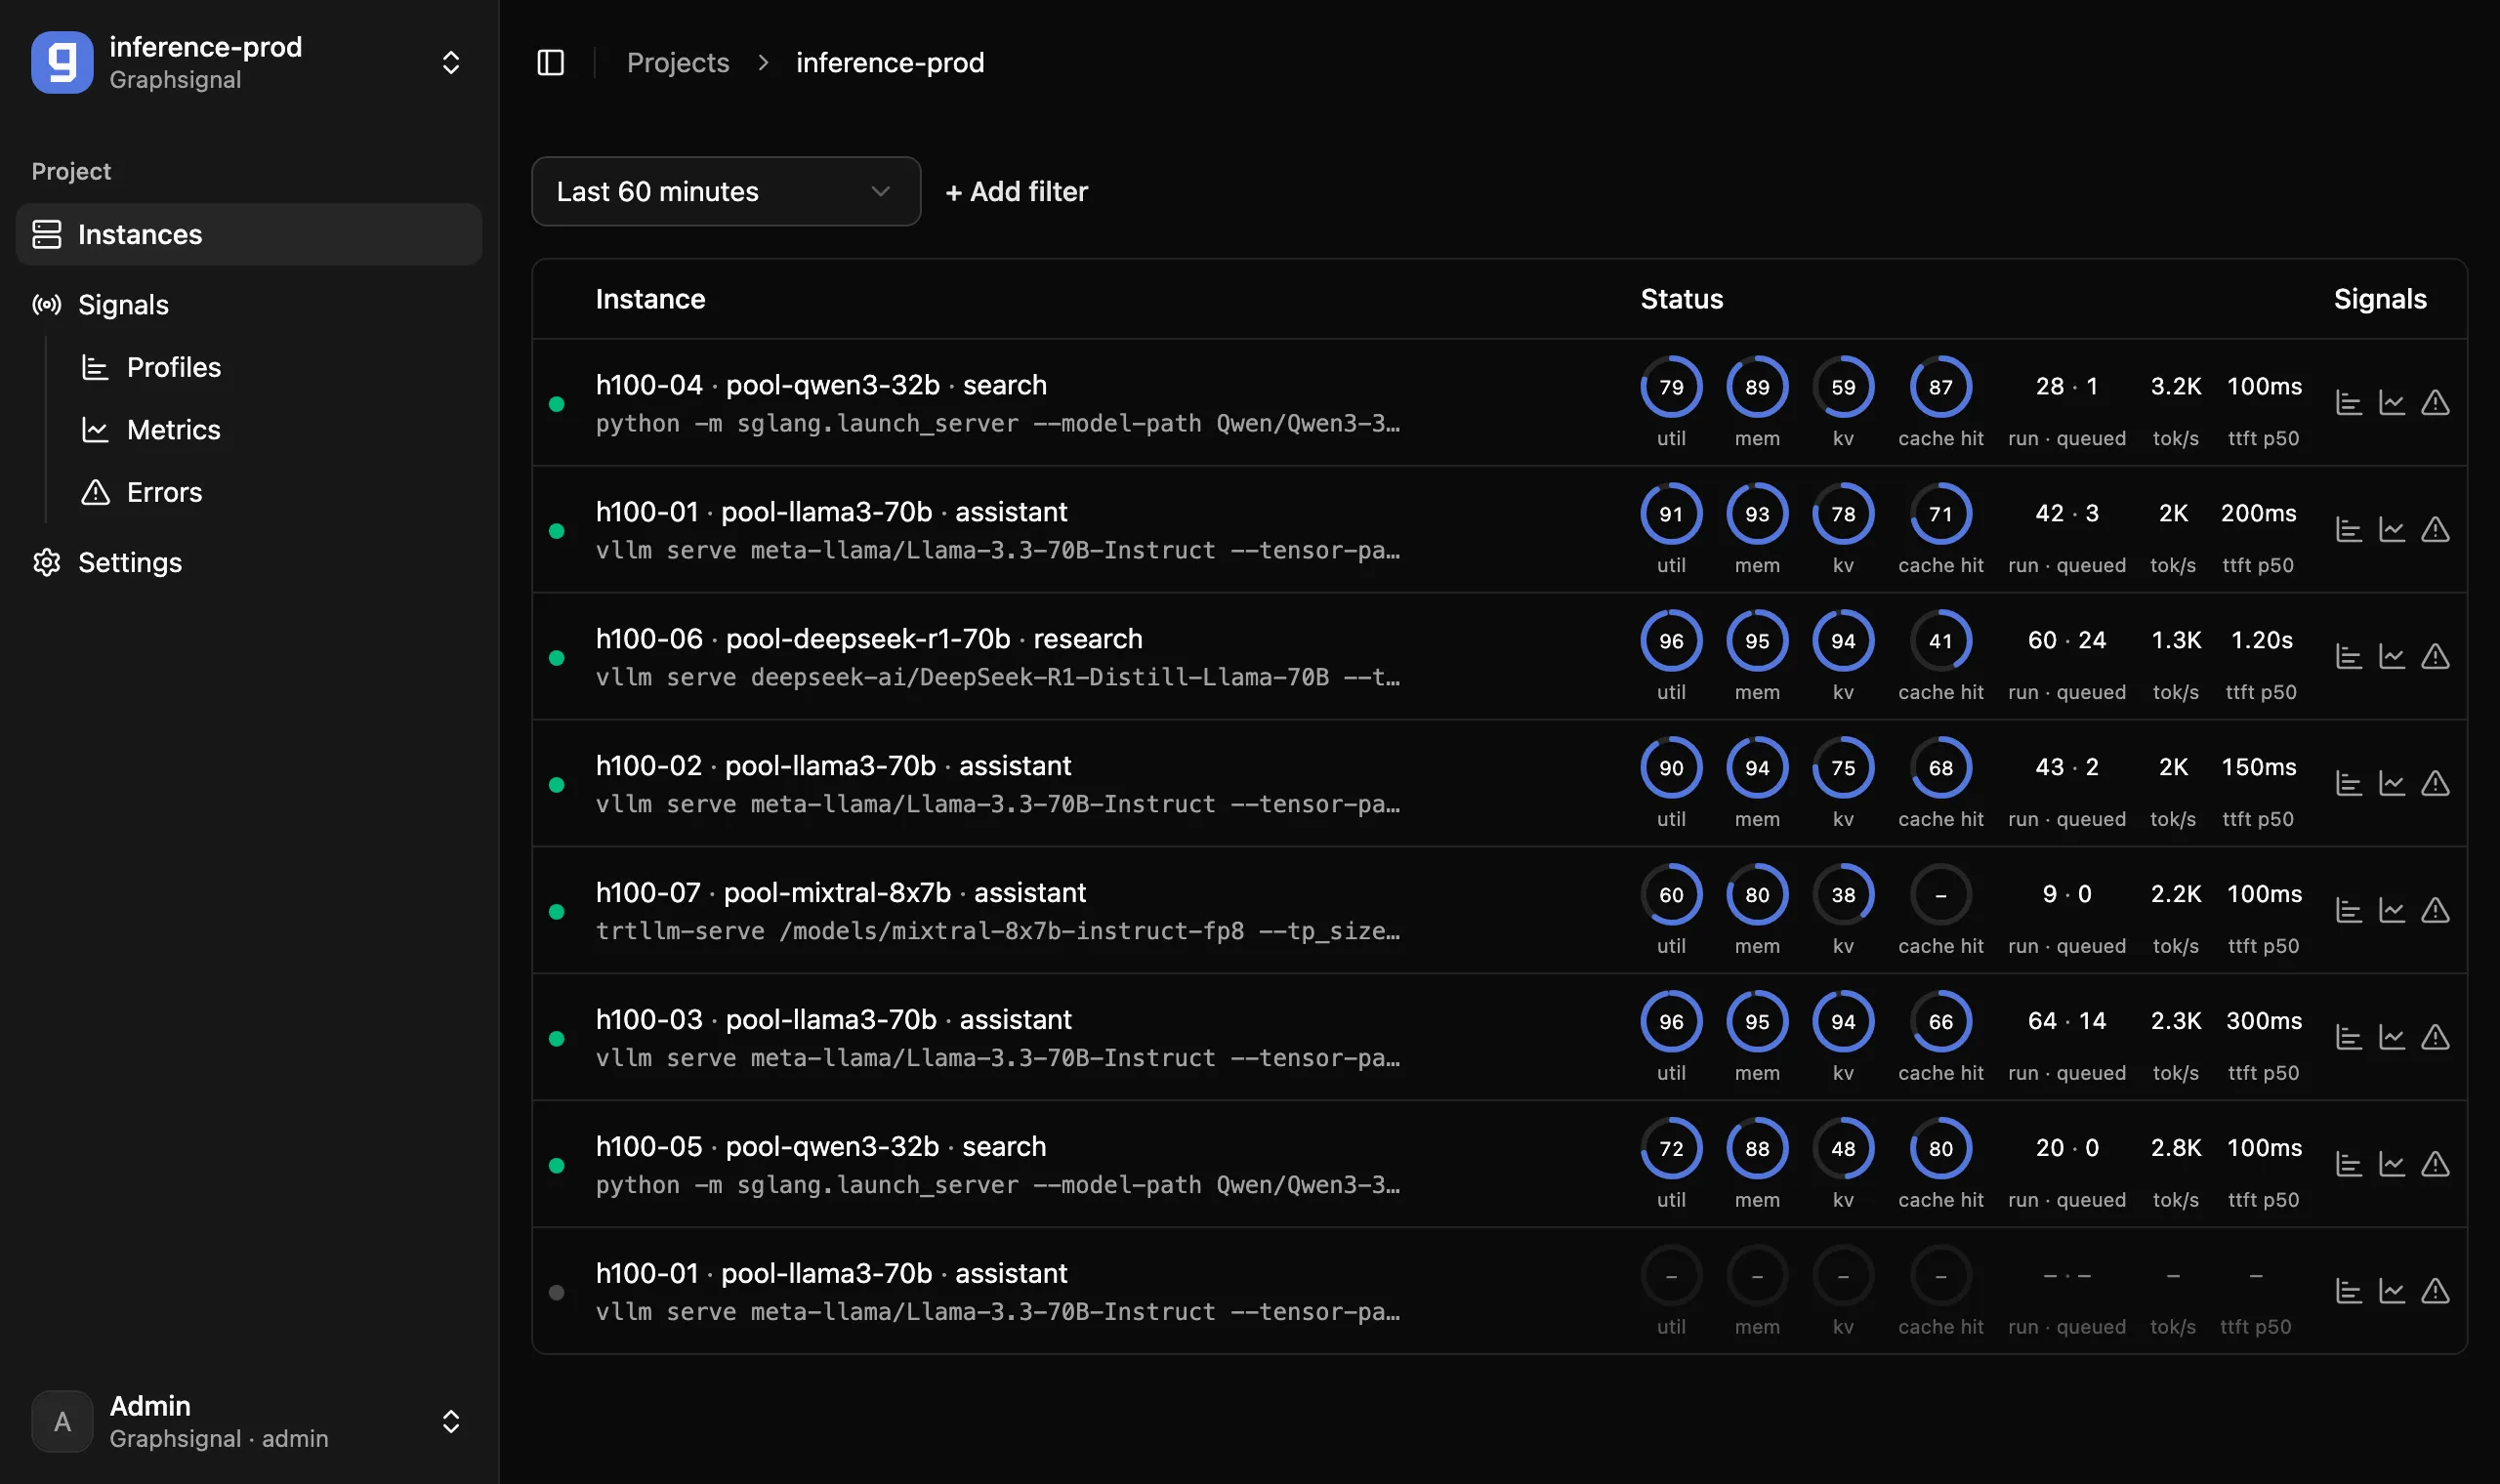
Watch your inference GPUs live
graphsignal-top shows the same signals as a live terminal screen: GPU telemetry, engine throughput and latency, and kernels ranked by time, locally or over the network.
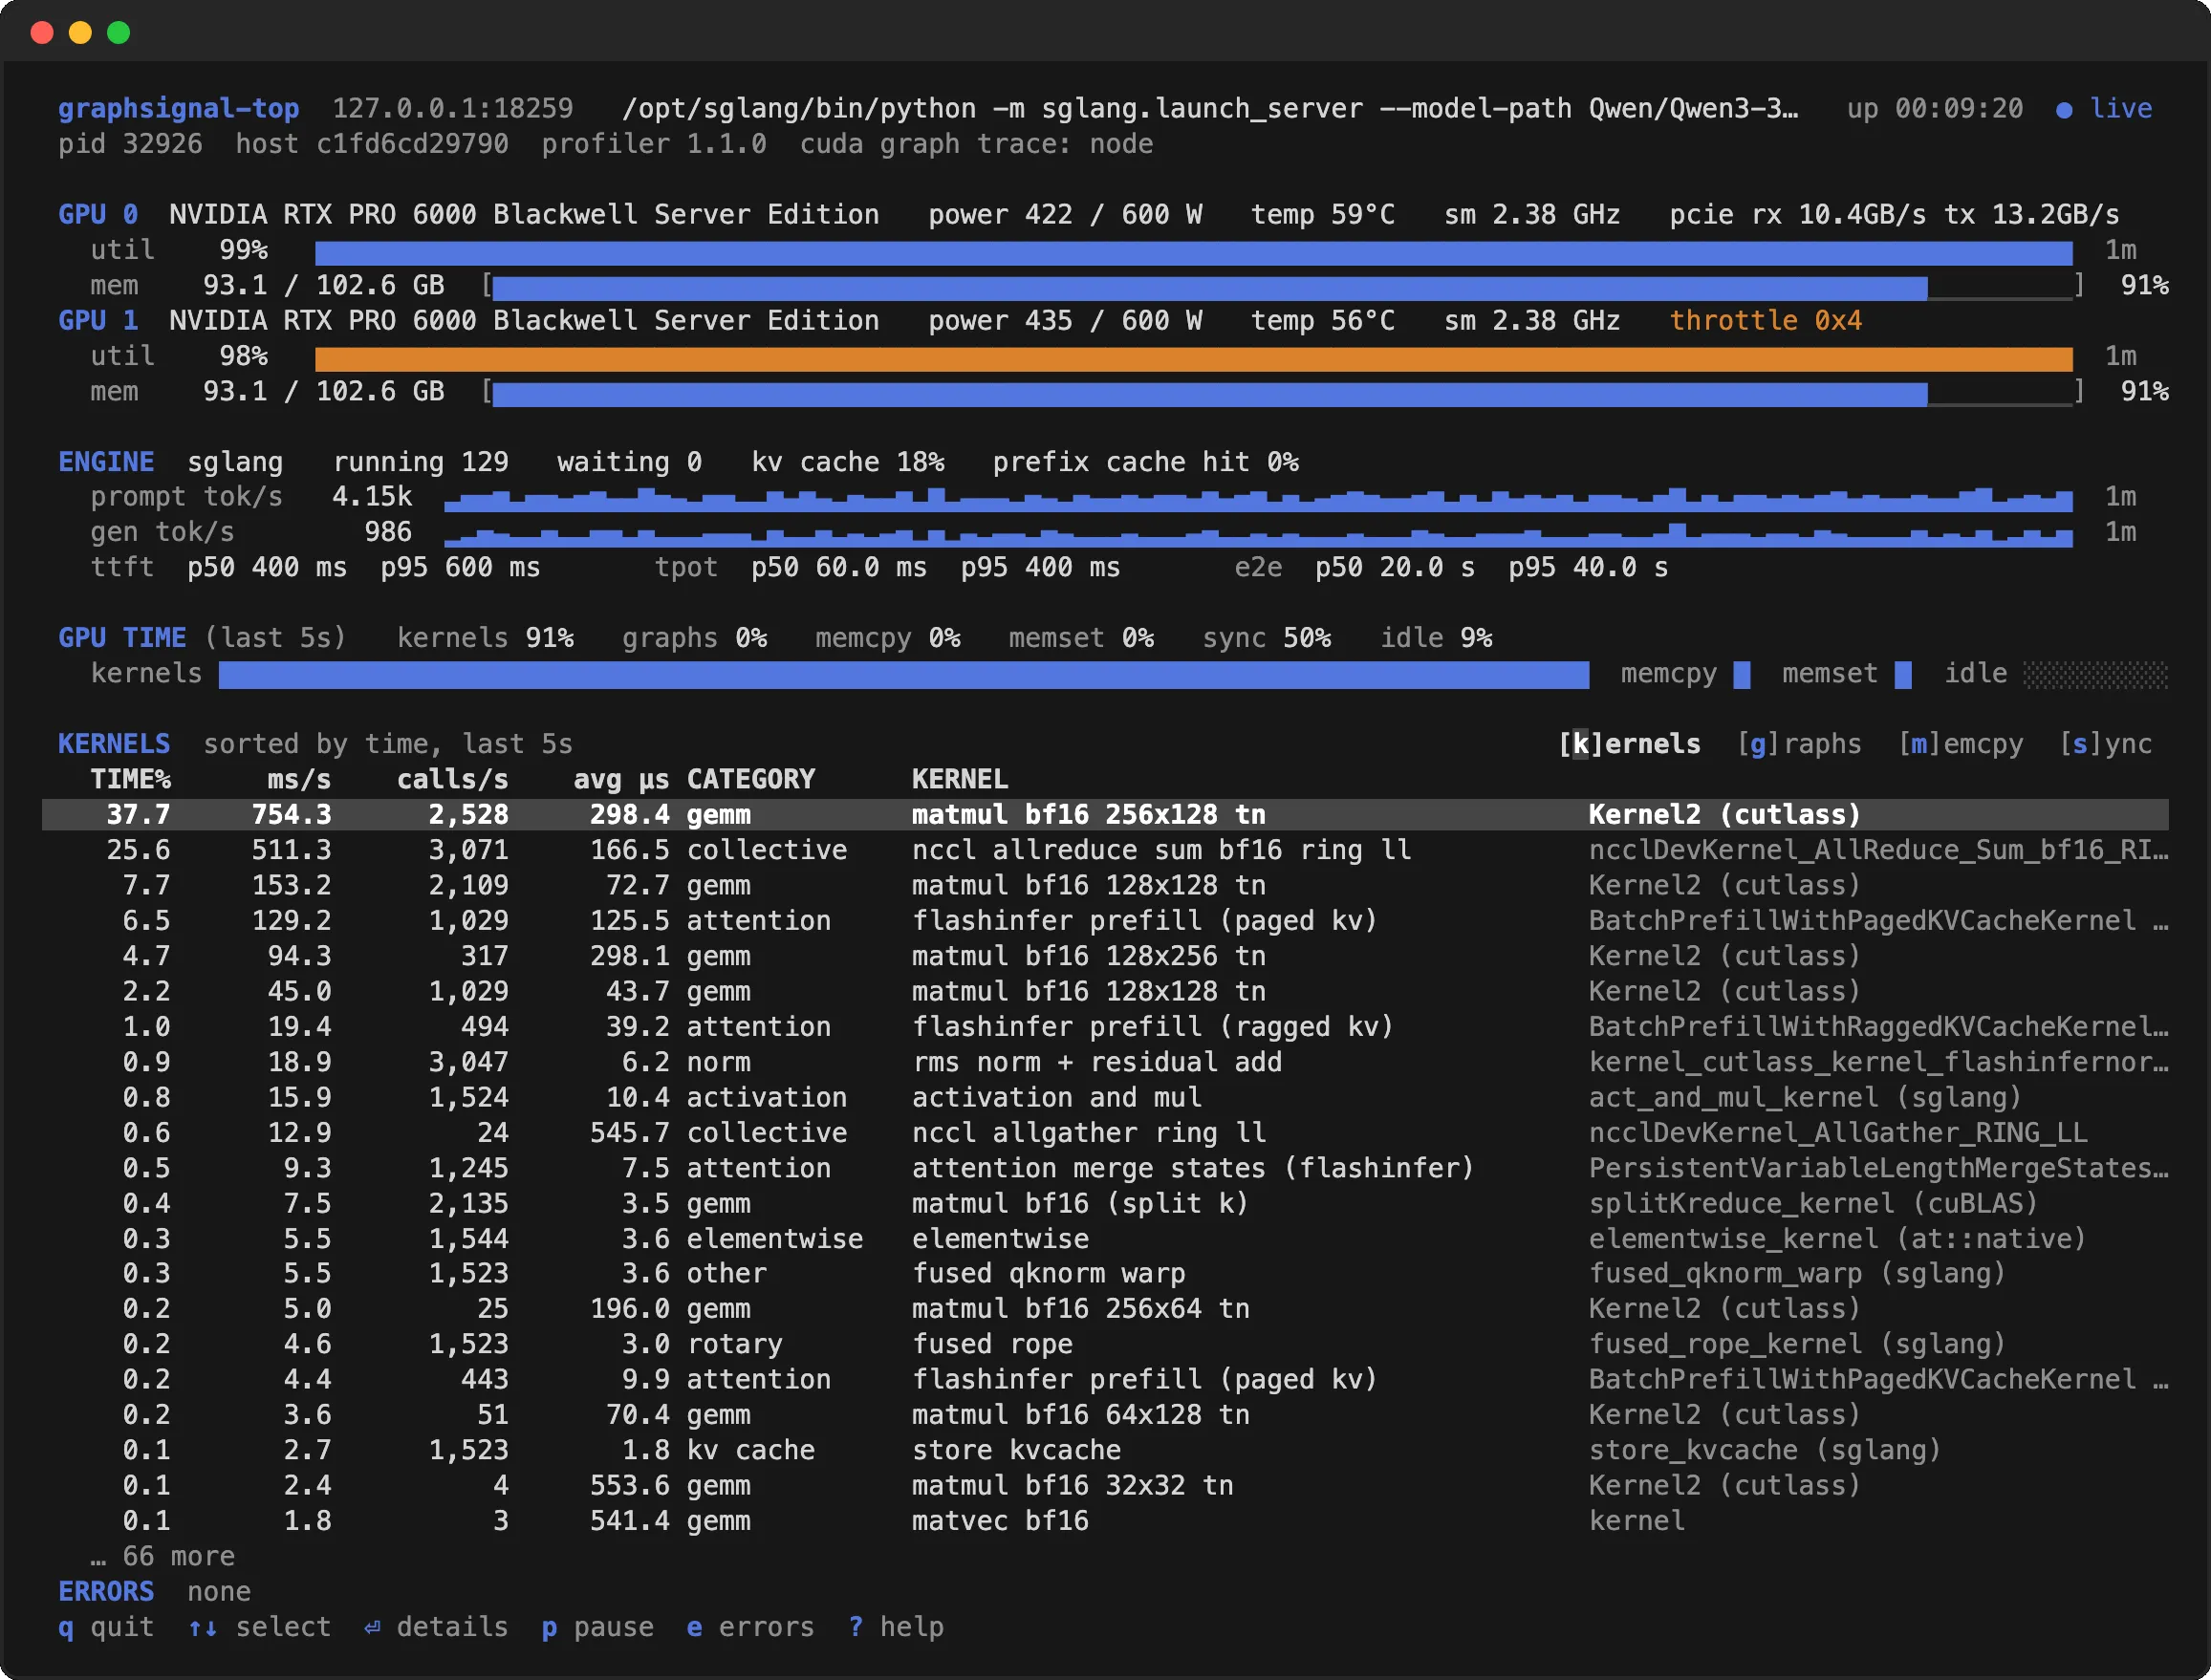
Inference profiling
Cumulative time per kernel, per CUDA graph, and per memory or synchronization operation via CUPTI and ROCm, plus GPU telemetry, engine metrics, and error capture.
GPU probes
A vendorable C++ header that you — or an AI agent — use to instrument application code and CUDA/HIP kernels. Lock-free recording, inert without the profiler — probe values appear next to the built-in profiles and metrics.
Built for AI agents
One local JSON endpoint serves everything measured. An agent launches the workload, reads what dominates, changes flags or code, and measures again — entirely on your machine.
Production feedback loop
Optionally, signals upload to Graphsignal, and agents read production behavior back via the Signals API to tune the next deployment. Without an API key, no profiling data is ever uploaded.