Tracing and Monitoring LlamaIndex Applications
By Dmitri Melikyan |
| 1 min read
Learn how to trace, monitor and debug LlamaIndex applications in production and development.
LlamaIndex In Production
The LlamaIndex framework is valuable for developing data-intensive LLM-based applications. It offers ready-to-use features for data ingestion, indexing, and querying.
When deploying LlamaIndex applications, especially when they are accessible to external users, it becomes important to ensure that the application functions as intended. This includes providing comprehensive visibility into indexing, prompting, embeddings, latency, reliability, and costs.
Tracing LlamaIndex With Graphsignal
Graphsignal automatically instruments and starts tracing and monitoring LlamaIndex applications. It's only necessary to set it up by providing Graphsignal API key and a deployment name.
import graphsignal

# Provide an API key directly or via GRAPHSIGNAL_API_KEY environment variable
graphsignal.configure(api_key='my-api-key', deployment='my-llamaindex-app-prod')
You can get an API key here.
In order to additionally trace other functions, e.g. request handlers, you can also use a decorator or context manager. See the Quick Start for complete setup instructions.
To demonstrate, I run this example app. It simulates periodic runs. After running it, traces and metrics are continuously recorded and available in the dashboard for analysis. Additionally, all traces are automatically recorded in case of exceptions, and anomalies.
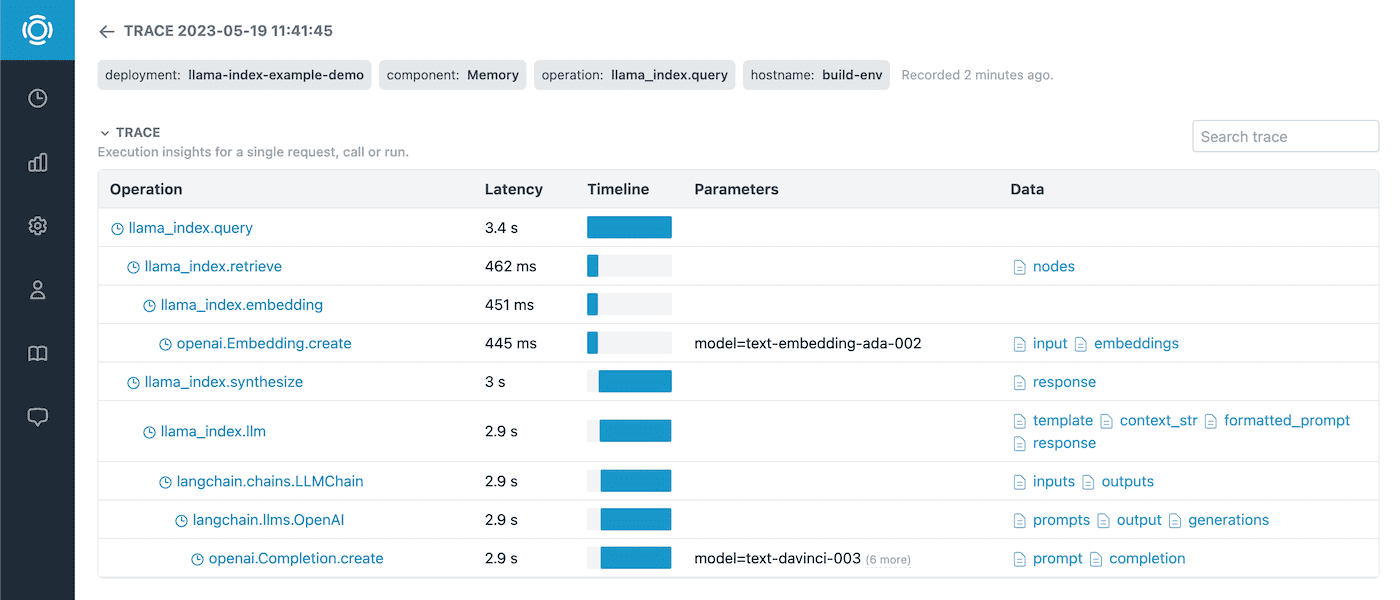
We can look into a trace to answer questions about latency, errors, prompts, retrieved nodes, embeddings information.
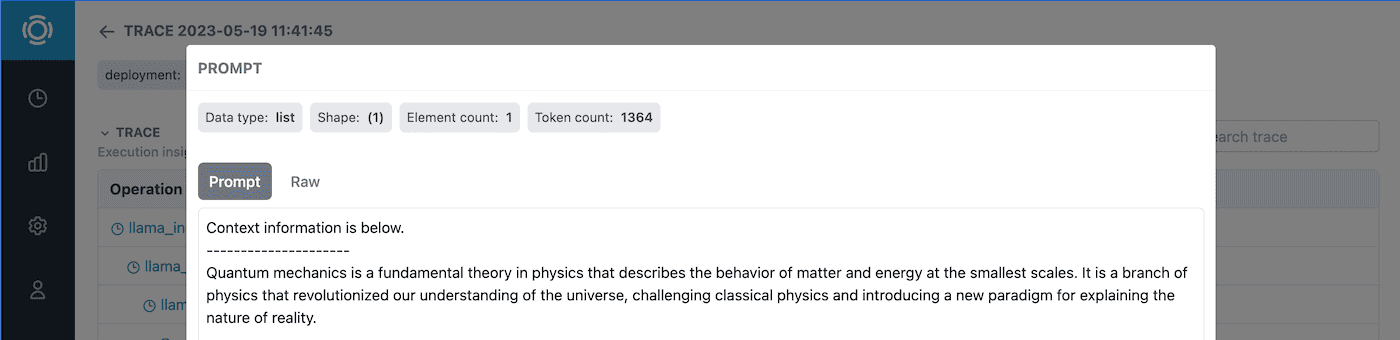
Prompts and completions are recorded along with the data statistics. This is instrumental for troubleshooting errors and data issues.
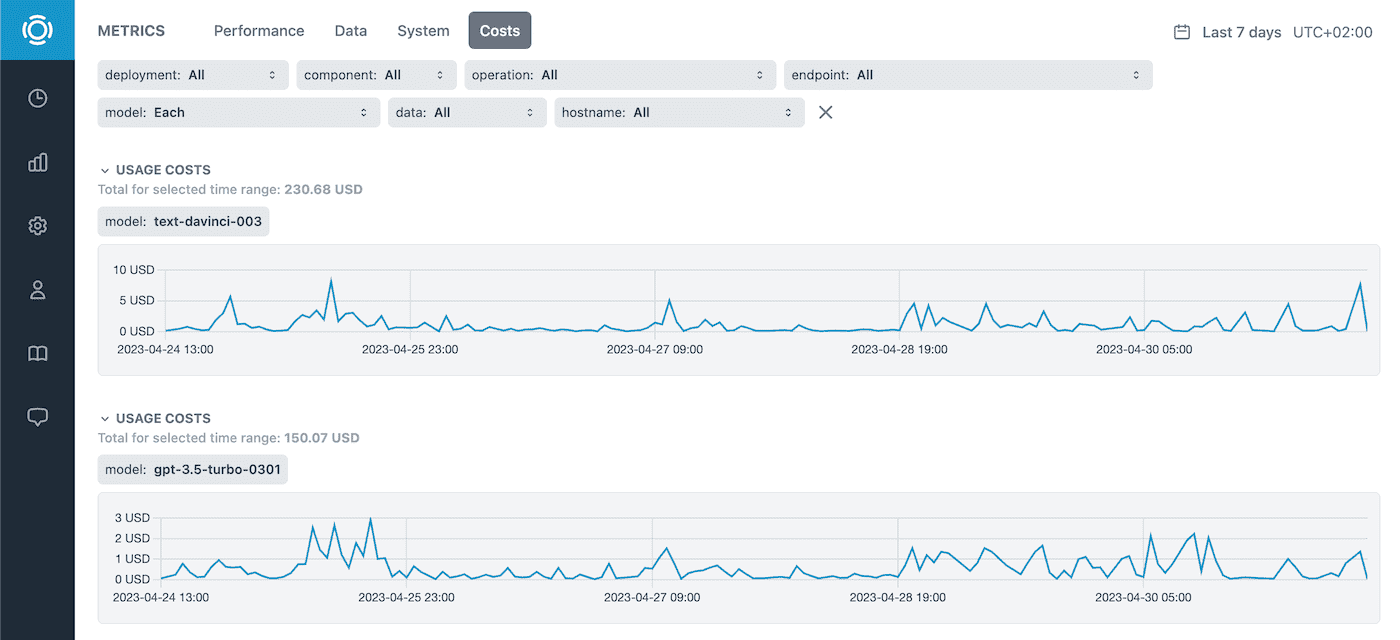
Tracking OpenAI API Costs
If OpenAI LLMs are used, Graphsignal automatically instruments and traces OpenAI API providing additional insights such as costs, token counts, sizes, and finish reasons.
Learn more about OpenAI cost tracking here.
Performance, Data, and System Metrics
Performance, data metrics, and resource utilization are available, to monitor applications over time and correlate any changes or issues.
Alerts can be set up to get notified on exceptions or outliers.
Give it a try and let us know what you think. Follow us at @GraphsignalAI for updates.