OpenAI API Cost Tracking: Analyzing Expenses by Model, Deployment, and Context
By Dmitri Melikyan |
| 2 min read
Learn how to easily track, analyze and monitor OpenAI API expenses for your AI agent or application.
Tracking OpenAI Costs In Context of Applications
When applications that use OpenAI models through APIs are still in the development stage, the costs associated with running them are usually relatively low and can be easily overlooked. However, once these applications are deployed to production and are being used by many users, the costs can quickly add up and become significant. This is particularly true for autonomous AI agents built with LangChain or based on other frameworks. I wrote about tracing LangChain applications in one of my previous posts.
OpenAI API cost tracking by model, deployment, and custom context allows for a more granular and detailed analysis of AI expenses. By tracking costs at the model level, developers can identify which models are being used most frequently and driving up costs. This information can be used to optimize the usage of these models and potentially replace them with more cost-effective options. Tracking costs by deployment provides insight into the usage and performance of OpenAI models across different environments. Application and request context can be used to categorize OpenAI API costs as well. This may include tags based on business units, specific projects, or other relevant categories.
Using Graphsignal for Cost Tracking and Analysis
Graphsignal provides all-in-one observability platform for AI agents and applications. Cost tracking and analytics is one of the essential features. By adding Graphsignal tracer to your application, you automatically and continuously get insights about latency, prompts, compute, data statistics and costs. Here is how to set it up:
import graphsignal

# Provide an API key directly or via GRAPHSIGNAL_API_KEY environment variable
graphsignal.configure(api_key='my-api-key', deployment='my-langchain-app-prod')
You can get an API key here.
It is also possible to add Graphsignal tracer at command line to avoid code changes. See the Quick Start guide for complete setup instructions.
NOTE: When streaming is used for completion or chat requests, Grapshignal tracer does not count prompt tokens by default and therefore such requests will be undercounted in cost metrics. To enable token counting for streaming, simply pip install tiktoken, and the tracer will be able to use it for counting.
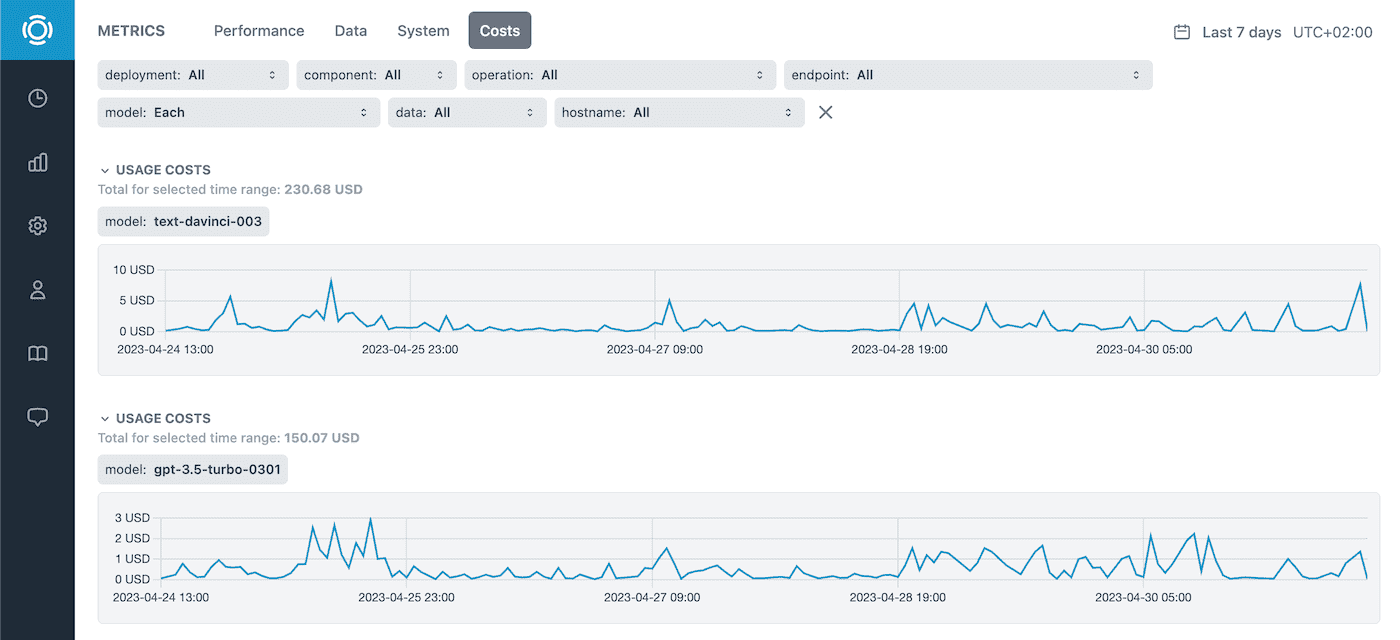
Here is an example of cost metrics dashboard showing cost charts and totals for each model for the selected time range.

It is similarly possible to aggregate and display costs by deployments or any other automatic or custom tags.
There are several ways to add custom tags:
- Environment variable
GRAPHSIGNAL_TAGS, e.g.GRAPHSIGNAL_TAGS='mytag=val' tagsargument tographsignal.configure()graphsignal.set_tag()method to set tags for the current run.graphsignal.set_context_tag()method to set tags for the current context, e.g. HTTP request.tagsargument to@graphsignal.trace_functiondecorator to set tags for the current trace.tagsargument tographsignal.trace()method orTrace.set_tag()method to set tags for the current trace.
See Python API Reference for more information.
Give it a try and let us know what you think! Follow us at @GraphsignalAI for updates.