graphsignal-top: a live view of your inference GPUs By Dmitri Melikyan |
The open-source Graphsignal profiler serves everything it measures as JSON for agents. graphsignal-top is the same data as a live terminal screen: GPU telemetry, engine throughput and latency, and kernels ranked by time, locally or over the network.
The open-source Graphsignal profiler is a sidecar for GPU inference. graphsignal-run wraps the launch command of vLLM, SGLang, TensorRT-LLM, or any CUDA or ROCm process, injects a small CUPTI or rocprofiler library into it, and serves everything it measures at http://127.0.0.1:18259/signals: cumulative time per kernel, per CUDA graph, per memcpy and sync kind; NVML telemetry; the engine’s own Prometheus metrics; errors from the console. One JSON document, the same shape on every read.
That shape is deliberate. The profiler was built for an AI agent to operate: launch the workload under it, put load on it, read /signals, change a flag or a kernel, read again. A SKILL.md teaches the agent the payload, and the comparison with torch.profiler and nsys explains why a comparable snapshot beats a trace for that loop.
People still want to look, though. Watching an engine under load, checking a box someone else is tuning, or just seeing whether the GPU is doing what you think it is doing. graphsignal-top is that view, in the profiler, on the same data.
graphsignal-top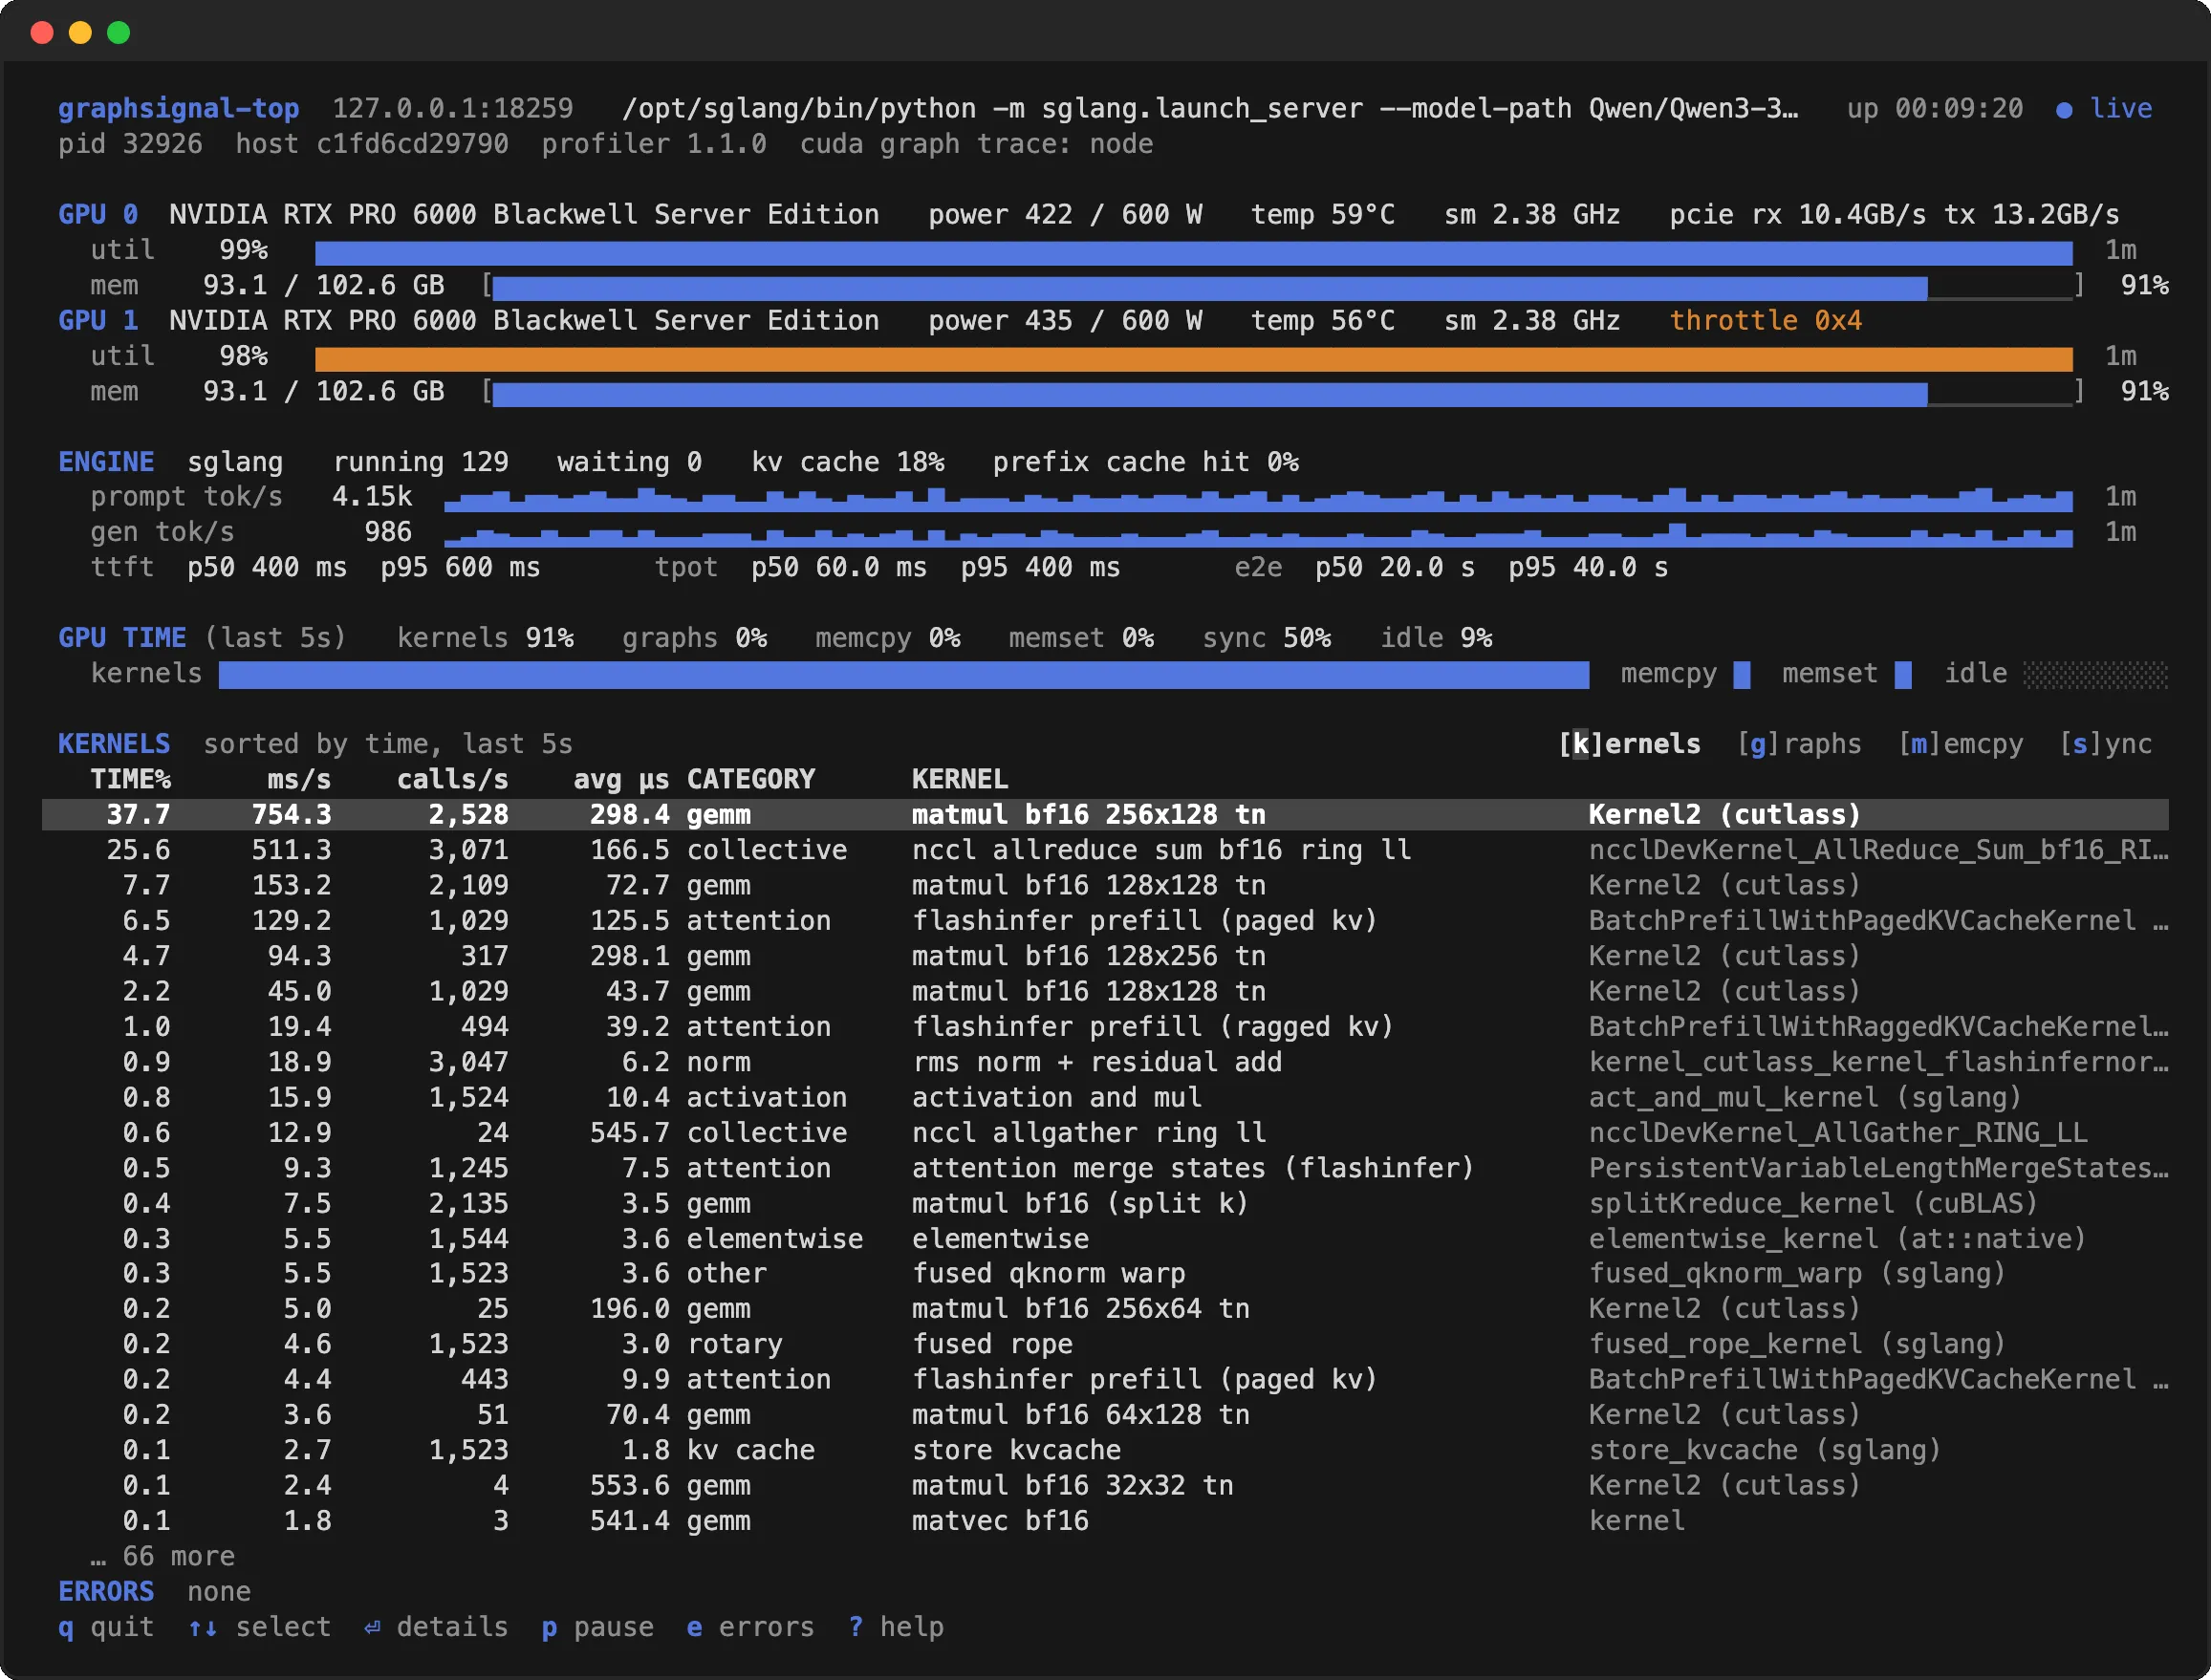
Top to bottom:
- GPU: utilization over time, memory, power, temperature, SM clock, PCIe traffic, XID errors, and throttling, per device. The amber row above is GPU 1 reporting a power cap while GPU 0 does not.
- Engine: running and waiting requests, KV-cache usage, prompt and generation tokens per second over time, and p50/p95 of TTFT, time per output token, and end-to-end latency, from the engine’s own metrics.
- GPU time: the share of a GPU-second spent in kernels, graph replays, memory copies and memsets, plus host synchronization time.
- Kernels: every kernel ranked by GPU time over the last five seconds, with a readable name and category next to the symbol. Tabs switch to CUDA graph replays, memory transfers, and sync kinds; the details view shows the full symbol, totals since start, and the per-process split.
The screenshot is two RTX PRO 6000s serving Qwen3-32B in tensor parallel, on a box where the GPUs talk over PCIe. The top row says what that costs: NCCL all-reduce is the second largest consumer of GPU time at a quarter of it, behind only the main gemm, and half of wall time is host synchronization waiting on it. That is the kind of thing a kernel table tells you in one glance and a trace tells you after an afternoon.
Local or remote
The view reads /signals, so it runs anywhere the endpoint is reachable. On the machine itself, graphsignal-top with no arguments. For a workload on another box, start its profiler bound to a reachable address and point the view at it:
# on the GPU boxgraphsignal-run --listen-host 0.0.0.0 vllm serve <model> --port 8000
# anywheregraphsignal-top --host gpu-box --port 18259
Or keep the endpoint on loopback and forward the port over SSH. graphsignal-top --once prints a single frame and exits, for a log, a script, or an agent that would rather read a page than a payload.
Install
uv tool install 'graphsignal[cu12]' # CUDA 12.xuv tool install 'graphsignal[cu13]' # CUDA 13.xuv tool install graphsignal # ROCm 7+Then graphsignal-run <your command> in one terminal and graphsignal-top in another. Both commands are in the profiler CLI reference.