AutoGPT Tracing: Prompts, Costs, Latency, Compute
By Dmitri Melikyan |
| 2 min read
Learn how to monitor, debug and analyze AutoGPT with Graphsignal.
Making AI Agents Observable
In one of my previous posts I showed how to trace and monitor LangChain applications. While LangChain is great for building custom AI agents, AutoGPT offers an experimental complete agent.
By default, when AI applications run, prompts and other events are logged. This may be sufficient when experimenting, but not when developing agents or running them in production. Here is a short (and incomplete) list of what insights might be missing.
- Traces: Visualizing related operations, errors, data (e.g. prompts) in execution context allows for a better understanding of AI agent interactions. A full trace may include details on LLM requests, embedding creation, memory retrieval, external tool usage, and other operations.
- Latency: It is important for diagnosing latency-related issues by analyzing latency distributions and any context such as request parameters and data.
- Compute: In both long-running production and local experimental applications it may be necessary to understand how resources are utilized. This is especially important when using local LLMs running on CPU/GPU or agent tools such as Python executors.
- Costs: Model API usage costs may be significant. Having the ability to analyze costs by deployments, models, users, and other criteria is critical.
We've built Graphsignal to make these insights automatically available for AI applications.
Tracing AutoGPT With Graphsignal
Graphsignal is built for production applications and can support many use cases ranging from local experiments to long-running high-traffic services. AutoGPT is currently an experimental project and is normally run locally in a single user setting. This scenario is easily supported by Graphsignal. Here is how to add it to your AutoGPT runs.
Instead of running AutoGPT the normal way with python -m autogpt, just install and add graphsignal to command line also providing API key and deployment name as environment variables.
pip install graphsignalenv GRAPHSIGNAL_API_KEY=your-api-key \
GRAPHSIGNAL_DEPLOYMENT=autogpt-local \
python -m graphsignal -m autogptGet an API key here.
For convenience, to be able to filter traces from for a single run, you can also add GRAPHSIGNAL_TAGS='run=1' environment variable and change the run tag for each run.
See the Quick Start guide for complete setup instructions.
Here is an example of what you would see after running AutoGPT agent and proceeding for a few steps and checking out the dashboards.
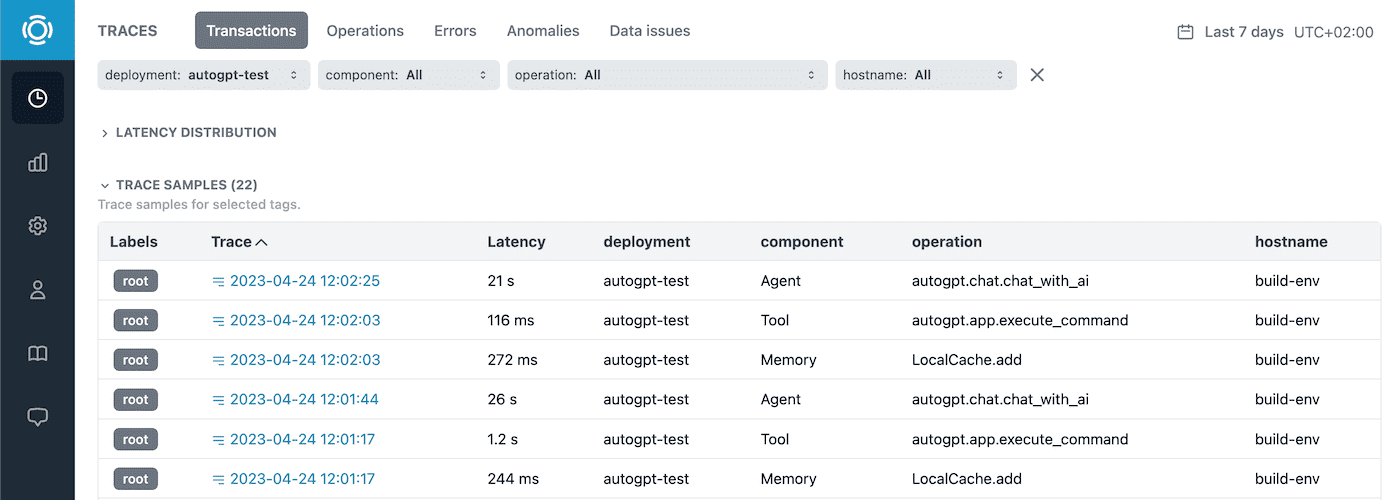
A list of traces includes high-level operations that the agent performed such as asking LLM, retrieving and adding memory, and executing a command. Traces with errors and anomalies are automatically labeled.
To get more information we can analyze any interesting trace.
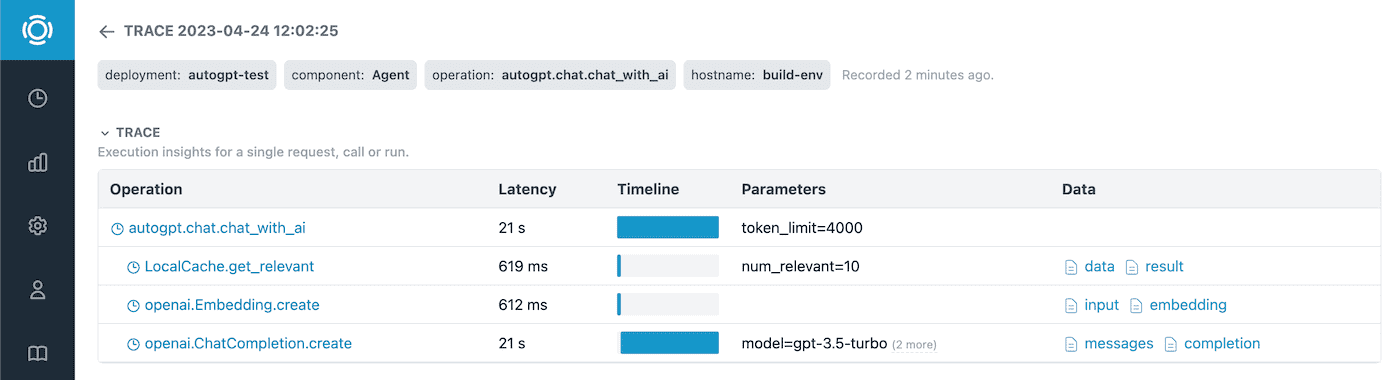
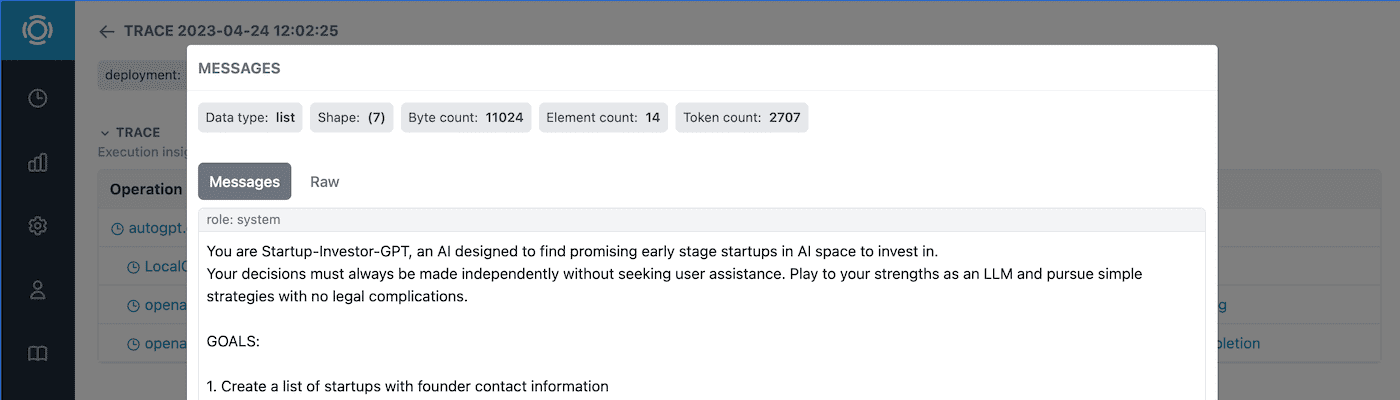
And view the prompts, completions, and other data.
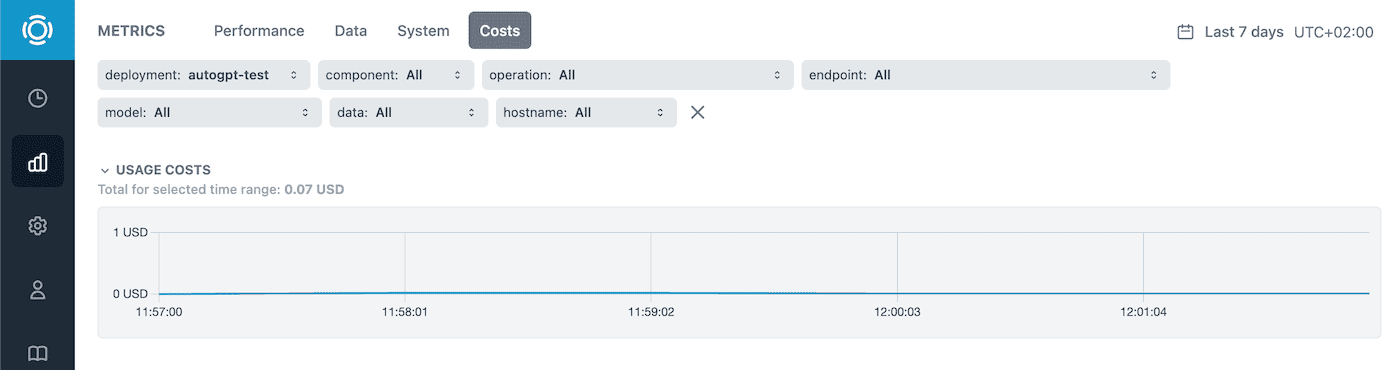
Last but not least, the cost metrics are available in the Metrics section along with performance and system metrics.
Give it a try and let us know what you think! Follow us at @GraphsignalAI for updates.