Tracing Chroma-Powered AI Applications
By Dmitri Melikyan |
| 1 min read
Learn how to trace, monitor, and debug applications that rely on Chroma embedding database.
Chroma In Production
Chroma is an AI-native embedding database. It is well-suited as a memory for AI agents, LLM apps, and many other use cases. One important aspect of Chroma is that it can seamlessly run locally as well as remotely, supporting both development and production use cases. Chroma integrates well with LangChain, which makes it even more powerful.
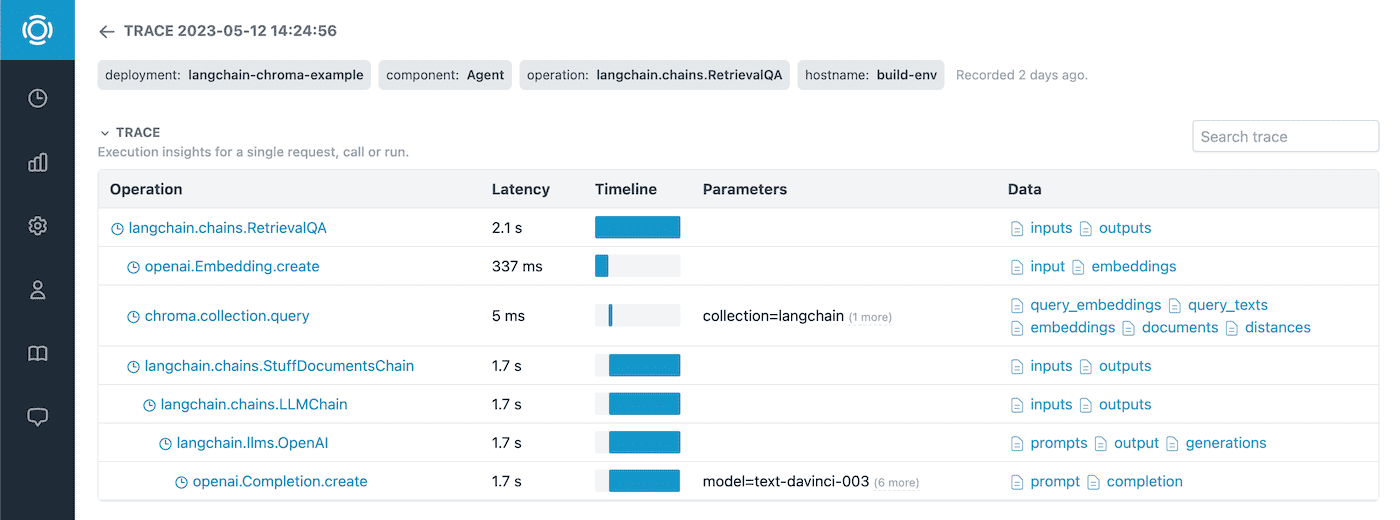
Being an essential component of the new AI stack, calls to Chroma need to be traced and monitored. This is important both in development and production, to ensure the applications behave as expected and users have the best experience. Tracing within the context of user requests, prompts and other operations helps gain a full understanding of applications. The essential signals include:
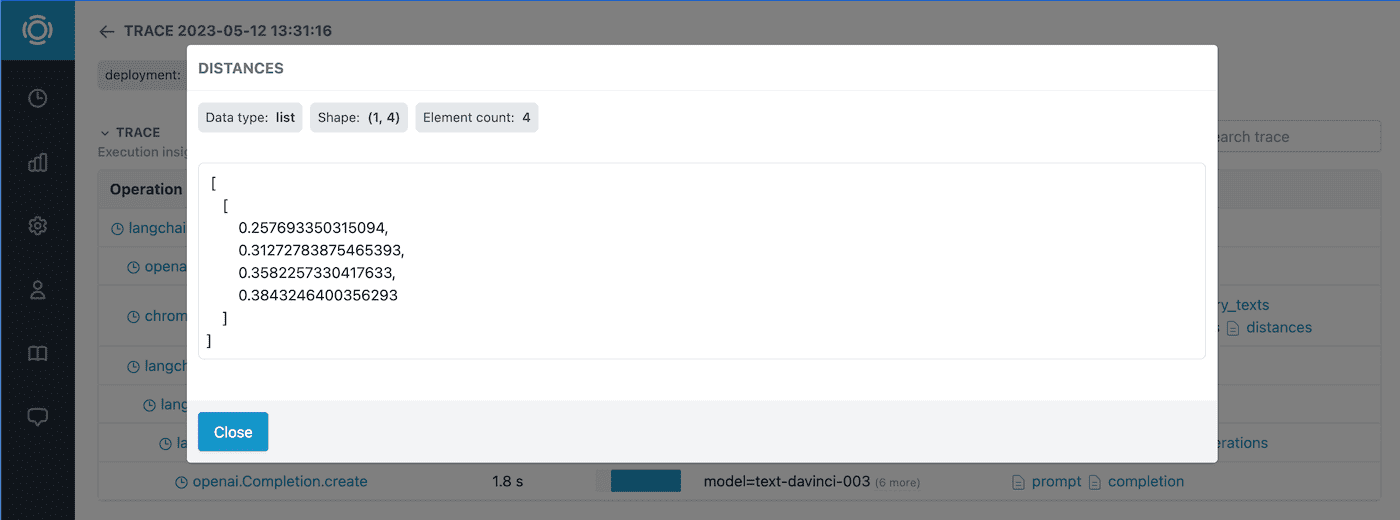
- Data flows, including prompts, documents, embedding statistics, query scores/distances.
- Latency breakdown by operation.
- Errors and exceptions.
- Outliers.
- Compute utilization.
Unlocking Full Observability: Adding Graphsignal
Graphsignal automatically instruments and monitors Chroma library. All main commands are automatically traced and monitored. Besides reporting latency, throughput, and data metrics, Graphsignal also records Chroma-specific information, such as document samples, embedding statistics, and distances.
Graphsignal provides native support for LangChain tracing. When Chroma is used as part of a LangChain, Chroma traces will also appear in context of runs and/or requests, depending on the use case.
Here is a simple example demonstrating how to add the Graphsignal tracer. See the complete example here.
import graphsignal

# Provide an API key directly or via GRAPHSIGNAL_API_KEY environment variable
graphsignal.configure(api_key='my-api-key', deployment='my-langchain-app-prod')
You can get an API key here.
After the application is started, traces and metrics are automatically recorded and available in the dashboards.


Give it a try and let us know what you think! Follow us at @GraphsignalAI for updates.